|
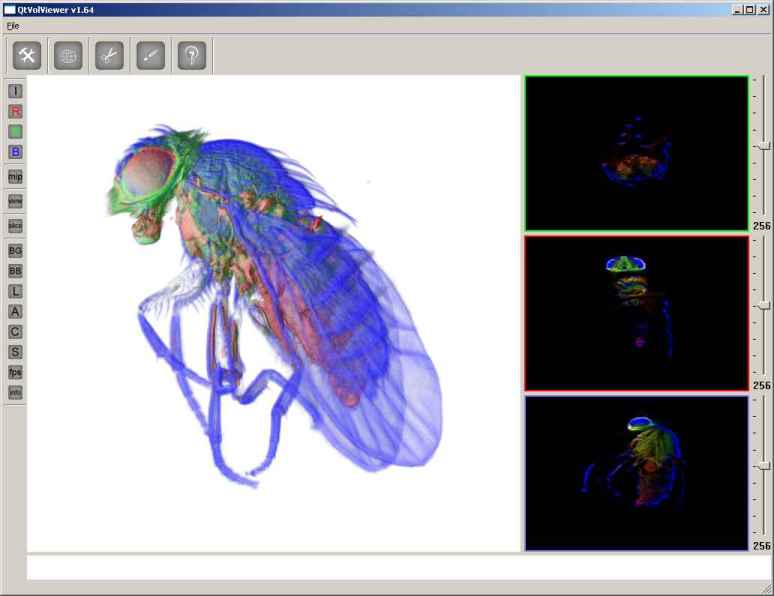
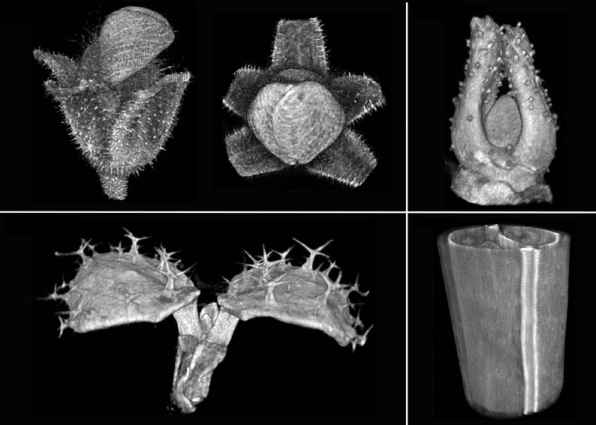
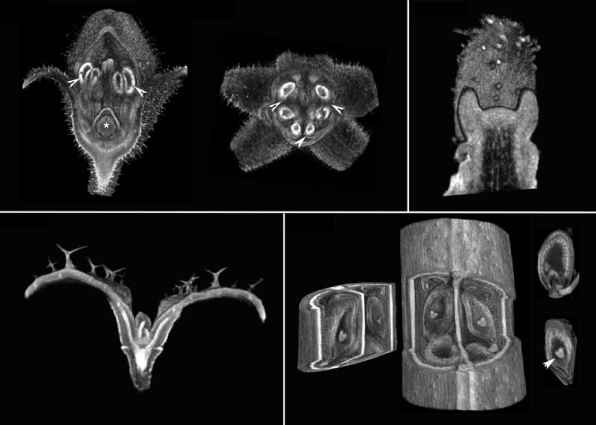
QtVolViewerThis project came as a product of my PhD. I needed some software to be able to visualize volume data. More specifically Optical Projection Tomography (OPT) data. Volume data is simply an x,y,z position and a scalar quantity. This scalar quantity can represent some spatially varying property such as tissue density. For more details about my PhD go here. Not happy with what was readily out there to view this data, I created my own volume renderer.
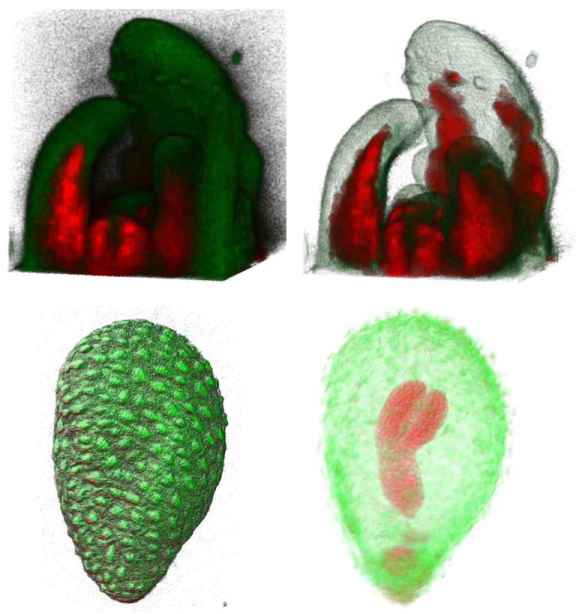
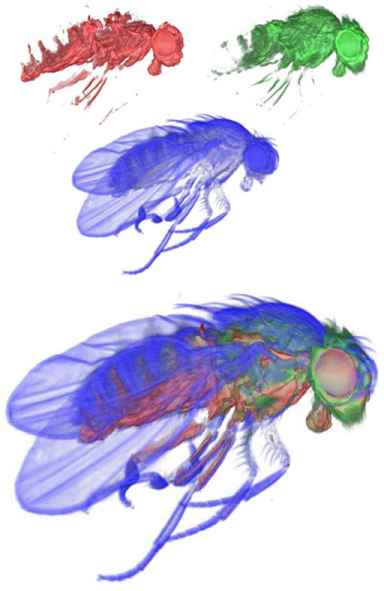
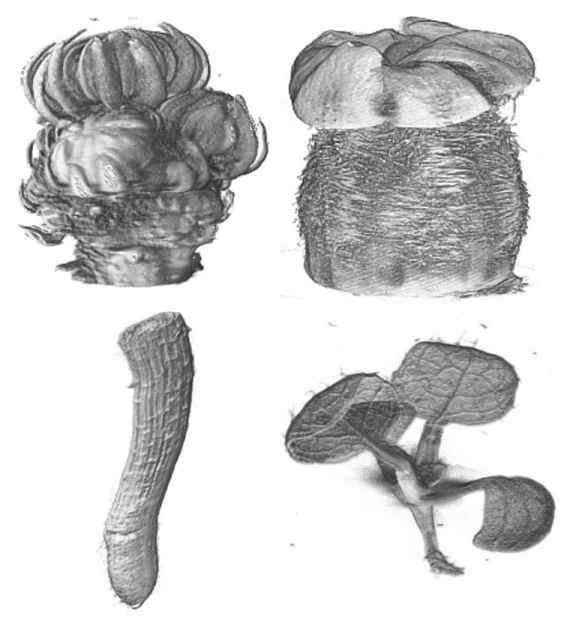
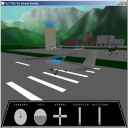
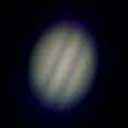
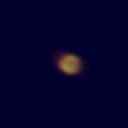
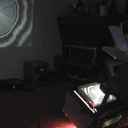
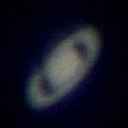
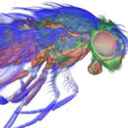
This application uses a slice based 3D texture volume rendering algorithm. It uses OpenGL and the GLSL to allow for advanced rendering features. These include; real-time transfer functions to control emission and absorbtion, global illumination, post-processing and multi-channel rendering just to name a few. A variant of the application was sold to Bioptonics and is currently shipping alongside the OPT scanner, as the main visualisation application. Below are some renderings produced using my application.
The application makes extensive use of fill rate and the GLSL. Sample data is included in the ZIP found below. Run the app and select OPEN -> BMP/PNG Slices and point it to some data in the directory. It is recomended to run the application on the following Nvidia cards: 7800GTX, 7900GTX & 8800GTX. Anything else is untested. A much less feature packed version is also available to download which should work on older graphic hardware. |

|